Dashboard
The dashboard displays various graphical charts and maps representing the data in the database. The dashboard is accessed by clicking Dashboard  in the shortcut bar.
Four dashboards are predefined; Loan Portfolio, Loan Averages, Delinquency, and Collections. Within each dashboard are built-in charts.
Loan Portfolio| Chart | Description |
|---|---|
| New Loan Count per Day | A line chart showing the number of new loans created on a daily basis. |
| New Loan Dollar per Day | A line chart showing the dollar amount in new loans created on a daily basis. |
| New Loan Count per Month | A line chart showing the number of new loans created on a monthly basis. |
| New Loan Dollar per Month | A line chart showing the dollar amount in new loans created on a monthly basis. |
| Portfolio Active Loan Count | A line chart showing the number of active loans in the portfolio. |
| Portfolio Active Loan Balance | A line chart showing the total balance of active loans in the portfolio. |
Loan Averages
| Chart | Description |
|---|---|
| Average Loan Balance at Origination | A line chart showing the average of all loans on the date of origination. |
| Average Principal Balance | A line chart showing the average of all principal balance. |
| Average Interest Rate | A line chart showing the average of all interest rates. |
| Average Interest Rate at Origination | A line chart showing the average of all interest rates on the date of origination. |
| Average Term at Origination in Days | A line chart showing in days the average of all loan terms on the date of origination. |
| Average Term Remaining in Days | A line chart showing the average number of term days remaining in all loans. |
Delinquency
| Chart | Description |
|---|---|
| Average Days Delinquent | A line chart showing the average number of days loans are delinquent. |
| Dollars Collected | A line chart showing the total amount of dollars collected. |
| Current Days Delinquent | A pie chart showing the number of delinquencies in a pie chart. |
| Average Days Delinquent by State | A map chart showing the average number of days loans are delinquent by state. |
Collections
| Chart | Description |
|---|---|
| Collector Actions per Day | A line chart showing the number of collector actions per day. |
| Customer Contacts per Day | A line chart showing the number of customers contacted. |
| Promise to Pay Count Made, Kept, Broken per Day | A line chart showing the number of pay count made, kept, and broken per day. |
| Promise to Pay Dollar Made, Kept, Broken per Day | A line chart showing the dollar amount of promises to pay made, kept, and broken per day. |
Note
Line (Stock) chart shows a data range selector which can be used to choose a data zoom (display) range. The navigator along the bottom of the chart shows the entire sampling range. The blue highlighted area within the range indicates the currently displayed area. Click and drag the entire highlighted area or move the handles on either side of the highlighted area to adjust the displayed area. The Zoom buttons (1m, 3m, 6m, YTD, 1y, All) along the top of the chart will adjust the highlighted area to the respective zoom range.Tip
Mouse over any data point on a chart to see a tooltip showing the actual data being plotted.Ribbon Bar
The active items in the ribbon bar performs the following functions.
| Command | Description |
|---|---|
 Copy Copy |
Copy the currently visible charts to the clipboard. Only the visible portion will be copied. |
 Print Print |
Print the currently visible charts. Only the visible portion will be printed. |
 Add Add |
Add a new dashboard. |
 Delete Delete |
Delete the selected dashboard. The predefined dashboards cannot be deleted. |
 Refresh Refresh |
Refreshes the data being used. |
Adding a New Dashboard and Charts
To add a new dashboard, click Add  . Enter a name and a description and click OK.
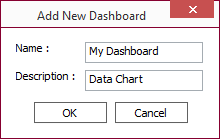
Right-click in the empty view area and select Add Chart from the contextual menu. Up to six existing charts or new charts may be added to a dashboard.
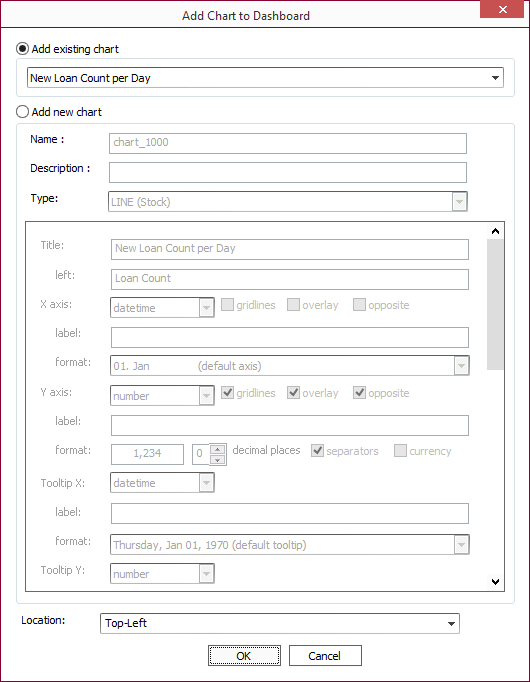
To add an existing chart to the dashboard, click the Add existing chart button and choose from a selection of predefined charts from the drop down list. Choose a location to place the chart within the dashboard from the Location drop down list and click OK.
To create a new chart to add to the dashboard, click the Add new chart button.
Give the new chart a Name as it will appear in the list of existing charts and a Description for the chart.
Choose from one of six chart types and set the parameters as defined for each of the chart types below. Once the parameters are set, select a predefined SQL query statement from the drop down list or enter a SQL query statement to retrieve the data to be displayed from the database.
Click Execute to see the results of the SQL query statement in the field below the button.
Click Tidy to see the SQL statement reformatted for readability.
Choose a location to place the chart within the dashboard from the Location drop down list and click OK. The new chart will appear on the dashboard.
The chart is also saved in the database and will be available in the existing charts list until it is deleted.
Chart Types
Line (Stock) and Line
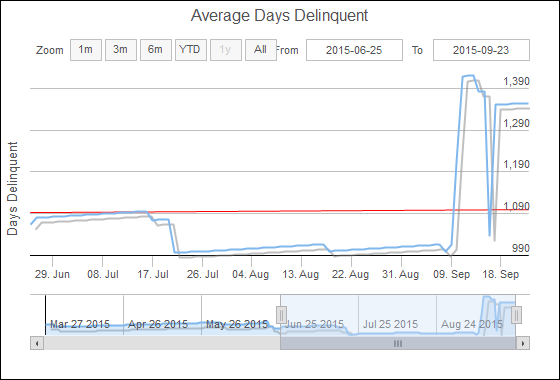
This is a simple line chart with an X and Y axis. The Line (Stock) chart shows an additional date range selector (Navigator) displayed within the chart.
| Option | Description | ||||||||||||||||||
|---|---|---|---|---|---|---|---|---|---|---|---|---|---|---|---|---|---|---|---|
| Title | Enter a title for the chart as it is to appear at the top of the chart. | ||||||||||||||||||
| Left | Enter a label for the Y axis as it is to appear along the left edge of the chart. | ||||||||||||||||||
| X/Y Axis options |
Drop down list to choose the data type of either a date or number to be represented on the axis.
|
||||||||||||||||||
| Trendline | Toggles the display of a linear regression trendline. |
Pie
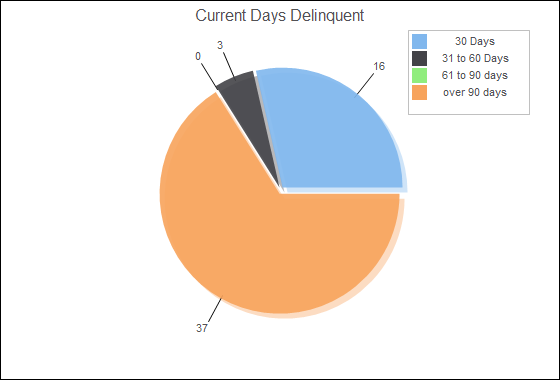
Options for the pie chart are:
| Option | Description | ||||||||
|---|---|---|---|---|---|---|---|---|---|
| Title | Enter a title for the chart as it is to appear at the top of the chart. | ||||||||
| Left | Not applicable. | ||||||||
| Tooltip X | Not applicable. | ||||||||
| Tooltip Y |
|
Table
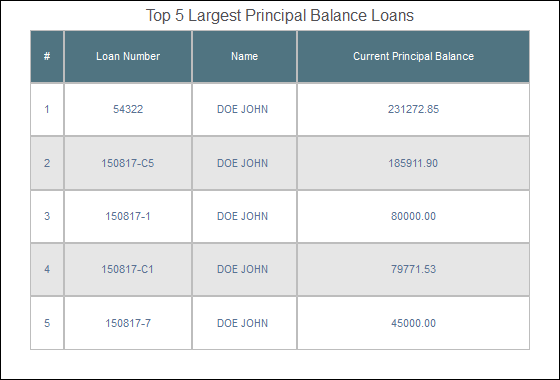
This is a basic table of data with the following options:
| Option | Description |
|---|---|
| Title | Enter a title for the chart as it is to appear at the top of the chart. |
Bar
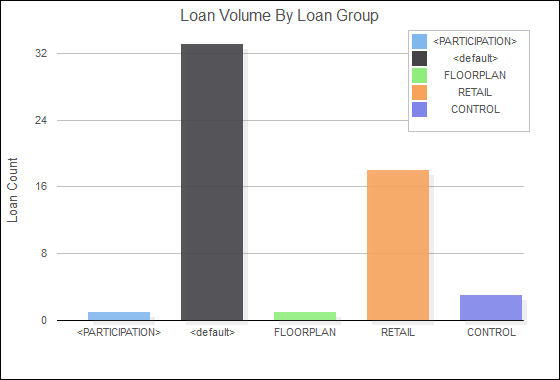
This is a simple bar chart with the following options:
| Option | Description | ||||||
|---|---|---|---|---|---|---|---|
| Title | Enter a title for the chart as it is to appear at the top of the chart. | ||||||
| Left | Enter a label for the Y axis as it is to appear along the left edge of the chart. | ||||||
| X axis | Not applicable | ||||||
| Y axis |
|
||||||
| Tooltip Y Label | Enter a label as it is to appear in the tooltip balloon. |
Map
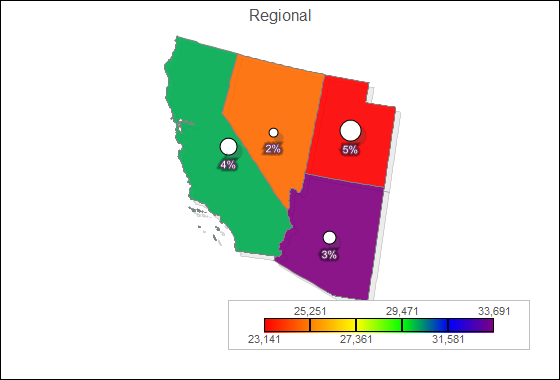
This is a geographic chart for the United States, United States - continental, United States + territories, Canada, Canada - under 71 latitude, United States + Canada, Mexico, and North America. Options for this chart are:
| Option | Description | ||||||||
|---|---|---|---|---|---|---|---|---|---|
| Title | Enter a title for the chart as it is to appear at the top of the chart. | ||||||||
| Left | Not applicable. | ||||||||
| Tooltip X | Not applicable. | ||||||||
| Tooltip Y |
|
||||||||
| Legend |
|
||||||||
| Gradients | Determines the colors used in the chart from a lower value (left) to a higher value (right). Click on the color swatch to choose a different color from the drop down palette or choose More Colors… to use a color picker. |
Contextual Menu
The following menu items are available when a chart or an empty space within the dashboard is right clicked.
| Menu Item | Description |
|---|---|
| Add Chart | Add a new chart to a dashboard. Option not available on predefined dashboards. |
| Resize enabled | The chart becomes moveable and resizable. To move the chart, hold down the Control key and click anywhere in the chart to move. To resize the chart, hold down the Alt key and click on its edge or corner to resize. |
| Float Widget | The chart can be moved to any location on your display and resized. |
| Float All Widgets | All charts becomes a window which can be moved and resized. |
| Dock Widget | Dock a chart to the dashboard display area. |
| Dock All Widgets | Docks all charts to the dashboard display area. |
| Full Screen | Displays the chart in full screen. Right-click and select Restore (ESC) or hit Esc on the keyboard to exit full screen view. |
| Copy | Copies the visible portion of the chart to the clipboard. |
| View Chart Information | Displays a NLS Chart Widget Information window showing detailed information of the chart. The XML and SQL query statement can be edited (except on built-in charts). |
| Remove Chart | Removes the chart from the dashboard. Option not available on predefined dashboards. |
| Delete Chart | Removes the chart from the dashboard and from the database. Built-in charts cannot be deleted. |
Dashboard Security
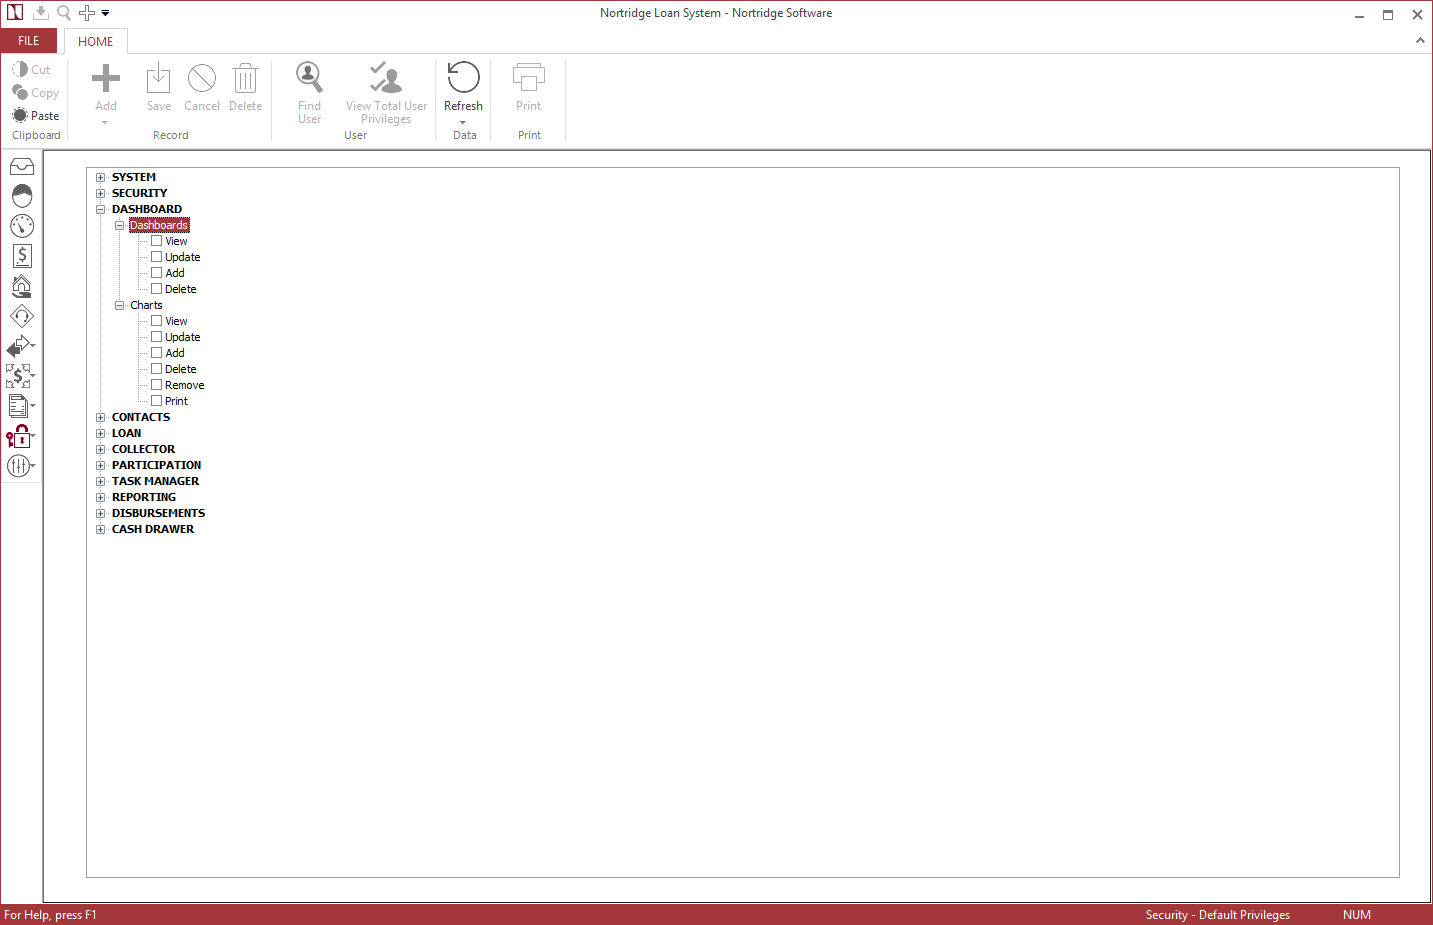
Dashboard privileges are granted to NLS users and function in the same way other security privileges are granted—through trustee, individual user privileges, and group privileges. The privileges can be assigned in:
Security > User > Privileges tab
Security > Group > Privileges tab
Security > Default Privileges
To edit Trustees on a per dashboard basis, right-click a dashboard and select Modify Security….
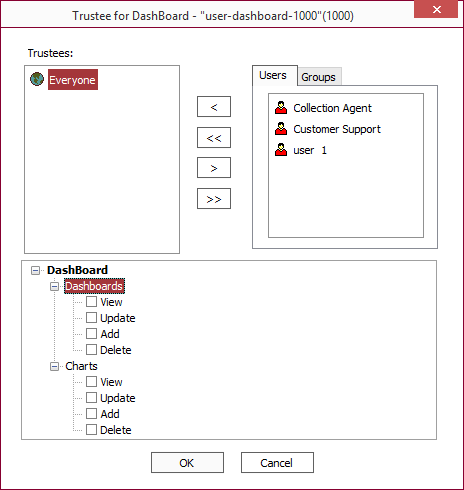
Privileges available are:
| Dashboard | |
|---|---|
| View | User is able to view all dashboards owned by everyone. |
| Update | User is able to rename all dashboards owned by everyone (except for built-in dashboards). |
| Add | User is able to add new dashboards. |
| Delete | User is able to delete all dashboards owned by everyone (except for built-in dashboards). |
| Charts | |
|---|---|
| View | User is able to view the XML in the chart information dialog. |
| Update | User is able to update every chart (except for built-in charts). |
| Add | User is able to add new charts. |
| Delete | User is able to delete every chart (except for built-in charts). |
| Remove | User is able to remove every chart (except from built-in dashboards). |
| User is able to print every chart. |
